Changes in food supply, demand, and per capita daily consumption by item in Japan 1960–2023
Diagram / illustration


Client: Private work
- 1,000×1,800 mm
- 印刷協力:(株)サン・ブレーン
- 撮影:工藤雪
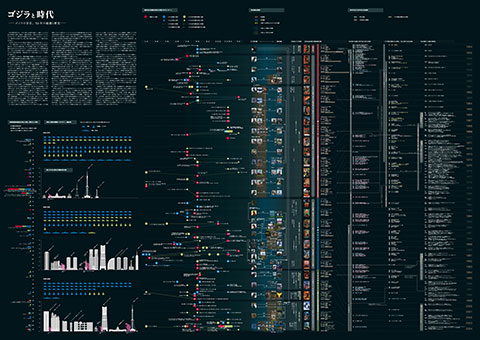
1960年から2023年までの米、小麦、牛肉、魚などの主要品目の国内生産量、輸入量、輸出量、国民1人・1日当たり供給粗食量をダイアグラムとして表現しました。
イラストをメインとしながら、日本で生産され消費される食品群それぞれの推移を可視化することで、時代によって変化してきた食生活を見つめるきっかけとなれば嬉しいです。
ファーストヴィンテージ・4/6判・270kgで6種類の紙を使用し、白インクの上から4色、さらにその上に銀インク、最後にクリアインクを10回刷り、仕上げました。
FUJIFILM Innovation Print Awards 2025 「ワイドフォーマット」部門 第1位
Asian Print Awards 2025 「Digital Posters」部門 銀賞
“These diagrams illustrate domestic production, imports, exports, and per capita daily crude food supply for key items such as rice, wheat, beef, and fish from 1960 to 2023.
Focusing on illustrations as the central visual element, the work aims to highlight trends in each food category produced and consumed in Japan, offering a chance to reflect on how dietary habits have evolved over time.”