SANMA
Changes in catch and price since 1989 to 2024
Changes in catch and price since 1989 to 2024
Diagram


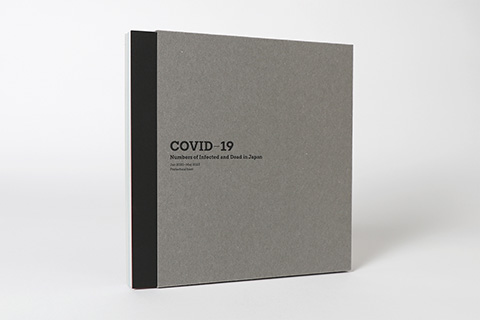
Client: Private work
- 210×297 mm
- 印刷協力:(株)サン・ブレーン
- 撮影:工藤雪
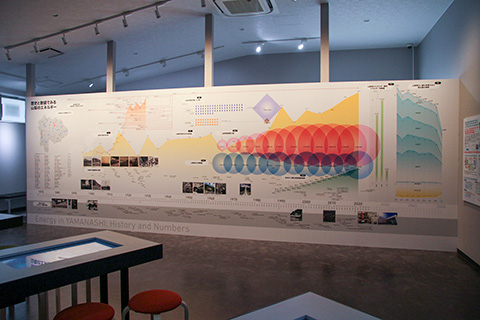
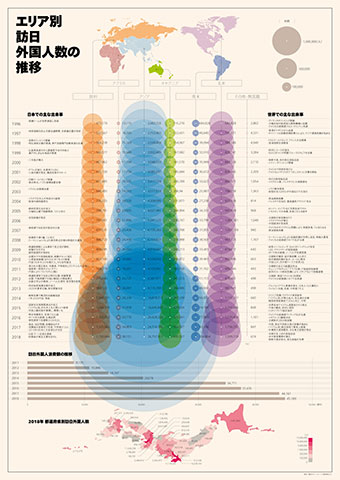
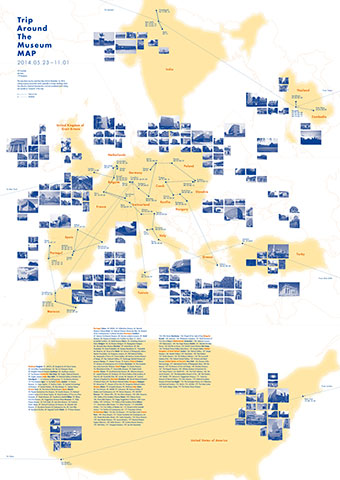
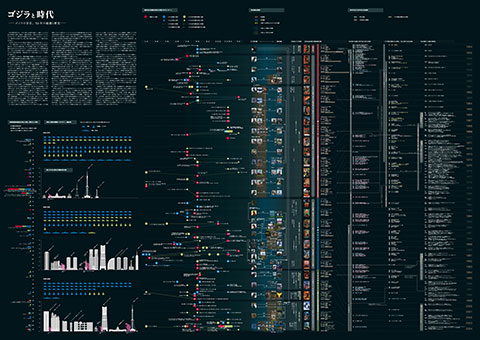
庶民の食べ物であったさんまが年々高騰しているニュースから着想を得て、1989年から2024年までの、全国および水揚げ港ごとの漁獲量、また10kgあたりの値段の推移をダイアグラムとして表現しました。
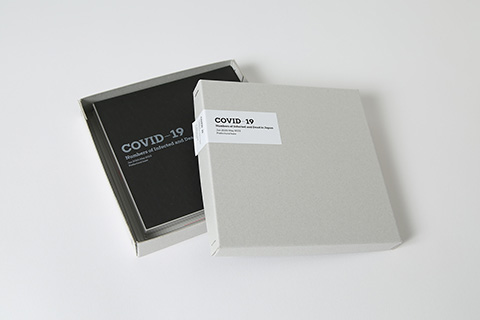
プライク-FS・ネイビー・720×1020 mm・T目・103kgを使用し、白インクの上から4色、さらにその上に銀インク刷り、ズラしコデックス装で仕上げました。
Inspired by news reports on the rising price of saury — a fish traditionally known as an affordable staple — I created a diagram visualizing trends in catch volume both nationwide and by landing port, along with the price per 10 kg, from 1989 to 2024.